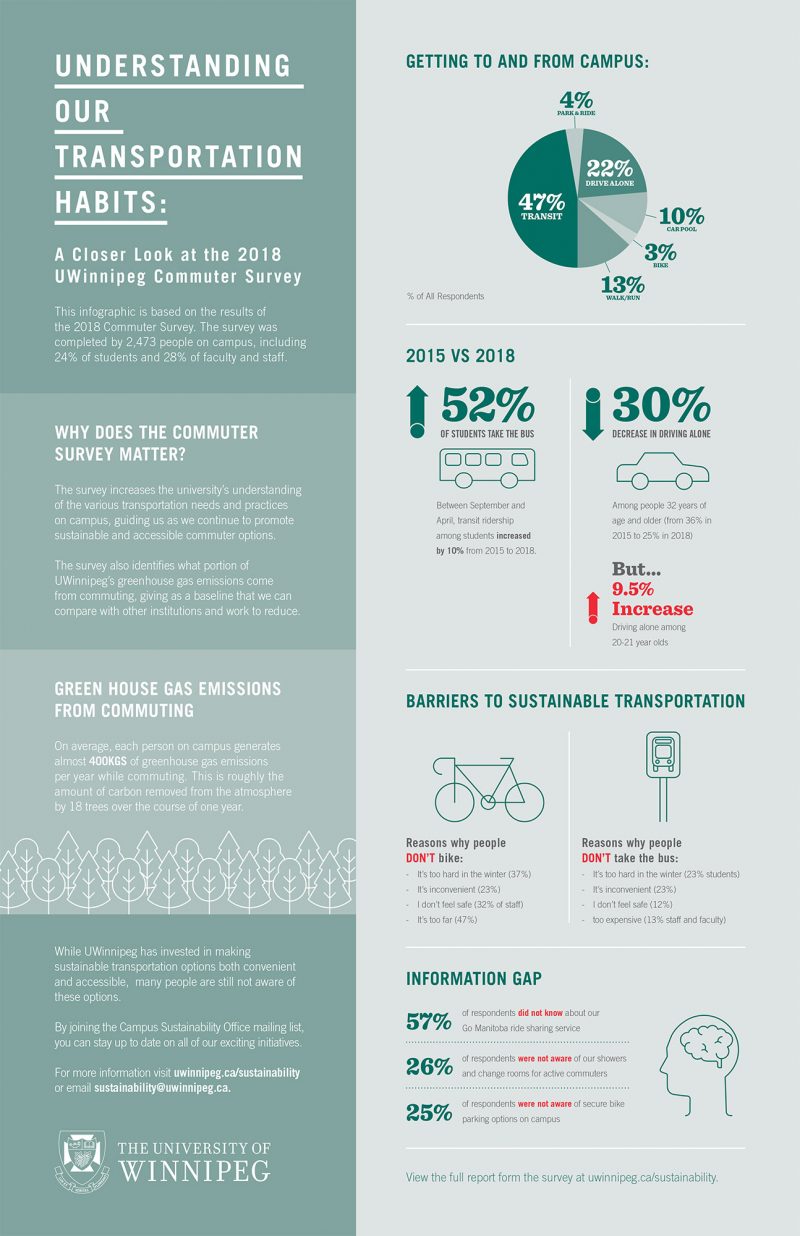
Transit use is up while bike ridership has fallen slightly among UWinnipeg students, faculty, and staff — these are the main takeaways from the Campus Sustainability Office’s (CSO) 2018 Commuter Survey.
This is the second time the University has commissioned a commuter survey through the Green Action Centre. CSO Coordinator Joseph Wasylycia-Leis is pleased with the increase in response rate since the inaugural questionnaire in 2015, including responses from 24 per cent of students and 28 per cent of faculty and staff.
“We were really happy to see nearly 2,500 responses to the survey because it provides an important and reliable dataset that we’ll use for our work at the CSO,” He said. “The data collected from this survey will help us advocate for polices and infrastructure that support sustainable and accessible commuting options for all of us.”
The purpose of the survey is to track how the community is getting to and from campus and identify barriers to different modes of transportation. The results are broken down by University role (students vs. faculty and staff); mode of transportation (transit, park and ride, drive alone, bike, walk or run); age group; and commuting behaviour by season.
The survey results give the CSO a better understanding of transportation needs and information gaps on campus.
Compared to the 2015 results, public transit use among students has risen and cycling has seen a drop — particularly during the fall-spring terms. Biking among faculty and staff has also seen a decrease, while walking and running to campus has increased among that group. The primary reasons for not pedalling to UWinnipeg for all respondents was distance and poor weather conditions.
“We’ve seen a slight increase in transit ridership and while we can’t say this definitively, this may be a result of the introduction of the student U-Pass,” said Wasylycia-Leis. “We’re also seeing a slight drop in cycle commuting, which tells us that we need to keep up with programs that introduce folks to the idea of biking to work or school.”
Download a detailed report of the survey results to find out how your commuting habits stack up.


